
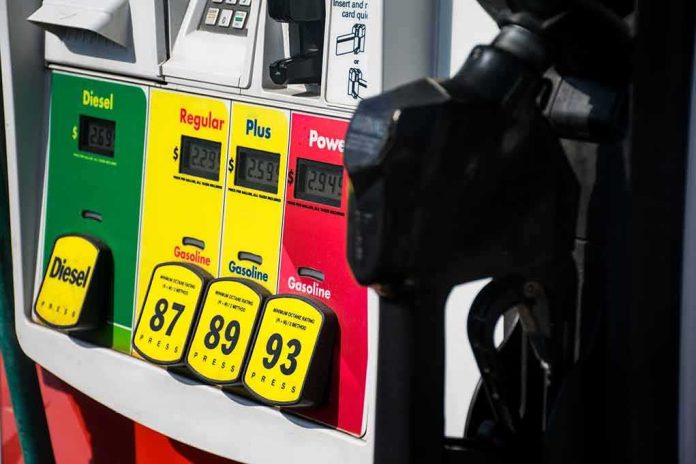
Labor Day set a new benchmark for pain at the pump because the national average price for regular gasoline moved above $4 per gallon for the first time on that holiday—an inflection point that blends seasonal demand, constrained supply, and the way the U.S. tracks retail fuel prices into a headline that actually holds up under scrutiny.
The Short Version
- AAA reported a national average around $4.14 per gallon heading into Labor Day, eclipsing the prior holiday record of $3.82 from 2012.
- “Record for Labor Day” is a calendar-specific claim, not an all-time high; the overall record for regular gas remains above $5 from mid-2022.
- AAA’s benchmark is built from widely used wholesale and retail feeds and reflects what drivers actually pay at the pump.
- Holiday “records” are common because gasoline is seasonal: summer demand, refinery outages, and hurricane risk frequently converge in late August and early September.
What the record actually is—and what it isn’t
AAA’s national average for regular gasoline reached roughly $4.14 in the run-up to Labor Day, and the organization stated clearly that the U.S. had never before entered that holiday with an average above $4. The previous Labor Day high-water mark, $3.82, was set on September 3, 2012; this year cleared that bar decisively, which is why you saw so many “most expensive Labor Day ever” headlines. That framing can confuse two different ideas. It does not mean gasoline set an all-time record; the U.S. broke $5 per gallon nationally in June 2022, driven by a global supply shock and tight refining capacity. The “record” here is specifically anchored to the Labor Day calendar.
Calendar anchoring matters because gasoline is inherently seasonal. Demand builds with summer driving, refineries push hard to meet it, and hurricane season threatens Gulf Coast infrastructure just when inventories are thinning. A record in early September says we came into the long weekend at the high end of the seasonal cycle.
How AAA measures prices—and why the benchmark endures
AAA’s published averages rely on retail transaction and posted price data aggregated through industry pricing services; the figure is not a poll of a handful of stations but a composite that aims to reflect what consumers actually pay, inclusive of taxes and local margins. The number updates daily and is reported alongside comparisons—yesterday, week-ago, month-ago, year-ago—so readers can place small moves in context. On the days surrounding the record Labor Day, that dashboard showed the national regular average above $4.14 and state-by-state spreads that explained regional sticker shock and relief alike. The same methodology has made AAA the default reference point for both travelers and editors who need a single, comparable number.
Could a different sample or a narrower basket of stations yield a slightly different average? Yes. But the power of a benchmark is consistency: year after year, the same yardstick enables meaningful holiday-to-holiday comparisons. If you accept the series for 2012 and 2023, you should accept it for 2026; that is precisely why the Labor Day “record” claim is defensible.
Why late-summer prices crest: demand, supply, and risk premia
Three forces typically drive late-summer gasoline upward. First, demand peaks as families finish summer trips; even modest increases in gallons sold can tighten local markets. Second, refineries are stretched after months of high utilization and defer maintenance until shoulder season, making unplanned outages more painful. Third, a hurricane threat in the Gulf of Mexico commands a risk premium in wholesale markets because so much U.S. refining and product logistics sit on that coast. When these conditions coincide with already-elevated crude prices or thin gasoline inventories, retail prices respond quickly. This year’s week-to-week climb into the holiday—small in absolute terms but landing above a symbolic $4 threshold—fit that pattern, which AAA flagged in advance and then confirmed with the national average print.
Regional variation amplifies or tempers the effect. States with higher fuel taxes or boutique gasoline specifications, such as those required in parts of the West Coast, tend to sit well above the national mean. Others, particularly near Gulf Coast refineries or with lower tax burdens, often sit below. AAA’s state averages illustrate the spread vividly on any given day.
Putting the milestone in historical context
Labor Day is a convenient yardstick because it caps the summer driving season, yet history shows wide dispersion. In 2009, during the long shadow of the financial crisis, national pump prices around the holiday were in the mid-$2s; by 2012 they had surged to the previous Labor Day high near $3.83 as global crude markets tightened. In 2023, the late-August national average hovered in the low-to-mid $3.80s, just shy of the 2012 holiday level, before slipping. Entering 2026, the market stacked enough bullish ingredients—firm crude, steady demand, localized supply constraints—to push the average past $4 and set a new Labor Day high.
Keep the other bookend in mind: the all-time national average record above $5 per gallon occurred in mid-2022, not on a holiday. That distinction explains why “most expensive Labor Day” can be true while “all-time high” is not. The AAA dashboard retains both facts: a daily national average series and a highest-ever series by grade, reported with date stamps.
Why the narrative repeats—and how to read it wisely
Holiday gas stories recur because the incentives line up neatly. AAA reinforces its role as the nation’s price barometer by issuing calendar-tied updates; newsrooms gain a clear, relatable consumer angle that local stations can localize in minutes; readers get a single headline that answers the question, “Will the drive cost more this year?” None of that makes the headline wrong—this year’s was right—but it can crowd out nuance. A few cents week over week can feel dramatic when it crosses a round-number threshold like $4, yet the more telling signals are the underlying series and the components that move it: crude benchmarks, refinery utilization, product inventories, and regional tax regimes.
For consumers planning travel, the practical move is to look beyond the national average. State averages, metro-level patterns, and even station brand dynamics frequently swamp the national signal. If you live in a reformulated gasoline market or along a congested distribution corridor, your local “record” may have arrived earlier—or may lag the national print. AAA’s state grid is the quickest way to translate the national story to your ZIP code.
We have several Wawa’s close to use and they have different prices. Gas was $4.39 today up 20 cents from yesterday. Happy Labor Day weekend. pic.twitter.com/WmaRYXIR02
— Cynthia Green 🇺🇸🦅 (@phillies1977) September 5, 2026
What to watch next
After Labor Day, gasoline typically drifts lower as demand eases and refineries switch to less expensive winter-grade blends. Exceptions happen when hurricanes dent Gulf Coast capacity or when crude prices climb sharply into autumn. If either materializes, the seasonal retreat could stall. Otherwise, the same dashboard that confirmed a first-ever $4-plus Labor Day will likely chart a gradual comedown into fall. Until then, the new holiday mark is not a statistical quirk; it is a clean readout of how tight summer gasoline can get when demand, supply, and risk all point the same direction.
Sources:
feedpress.me, usatoday.com, cnn.com, gasprices.aaa.com